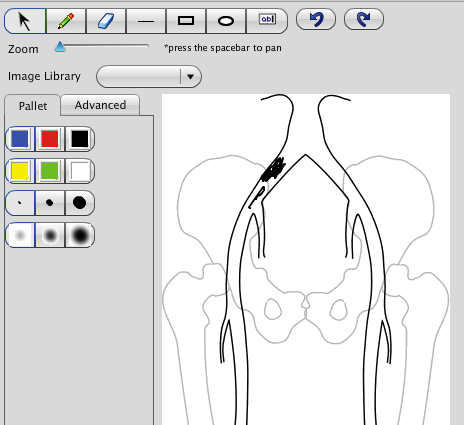
Leg Artery Drawing
Being able to communicate graphically is important for vascular studies because the images don't indicate where the probe is.
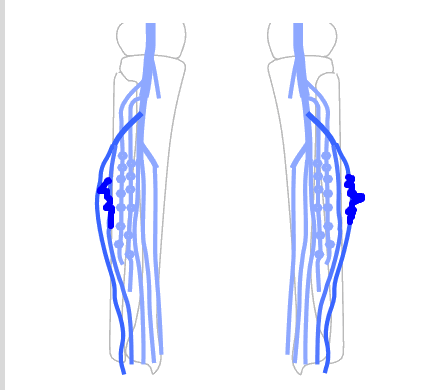
Venous Diagrams
Choose the large veins, the whole tree or superficial veins as the base drawing, then add clot or varicosities where seen.
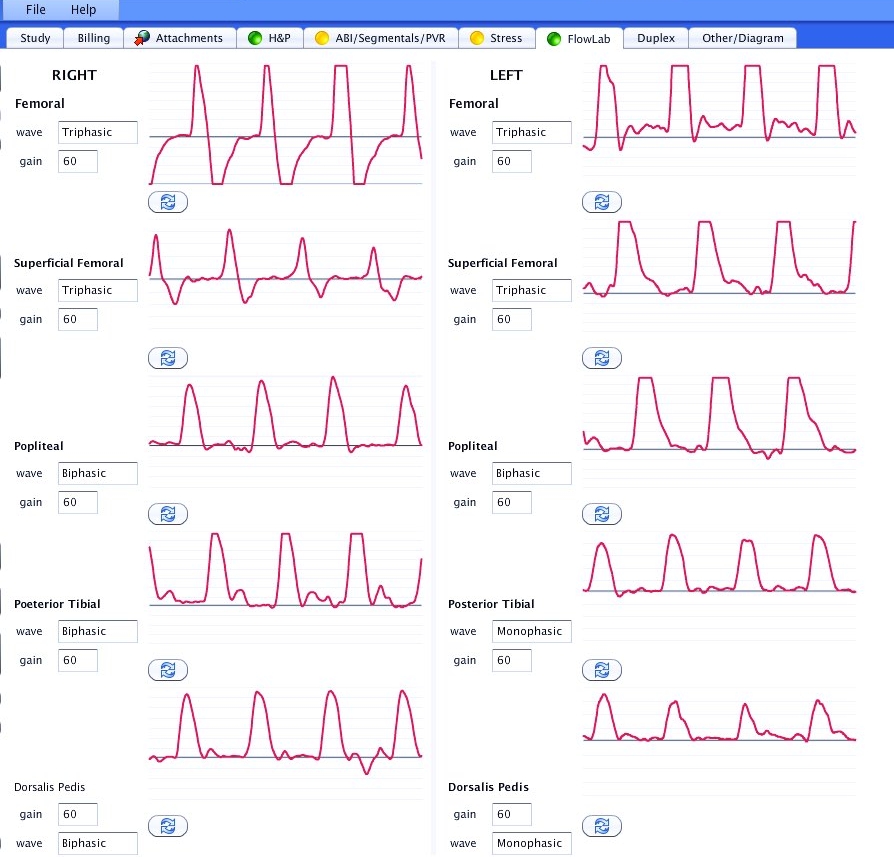
Parks FlowLab Import
Data and waveforms transfer into EncaptureMD vascular reports. Create a single combined report with Doppler, segmental pressures and PVR's.
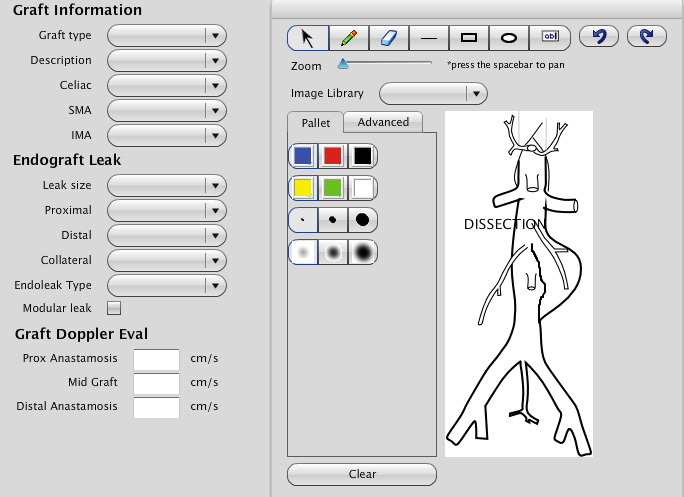
Aortic Drawing
There are 8 baseline drawings. Choose the closest and modify as needed. Add words or numbers to the drawing if you wish.
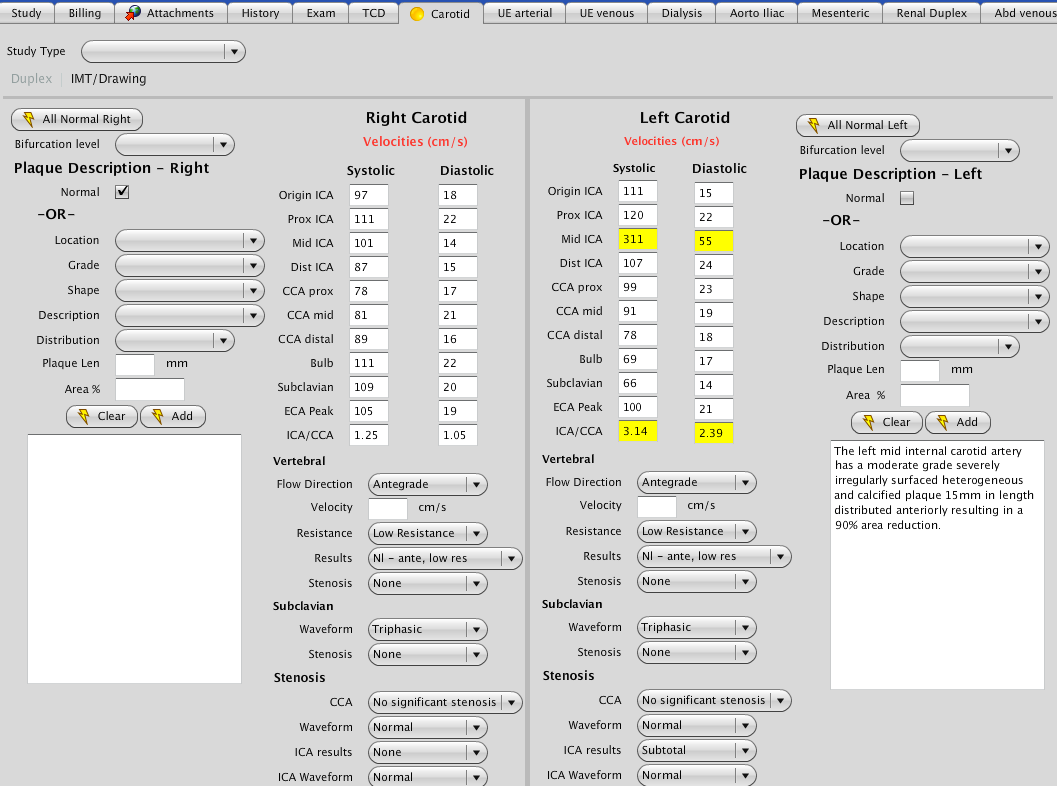
Carotid Data Entry
Measurements flow from the US machine and display here. Phrases are easy to generate.
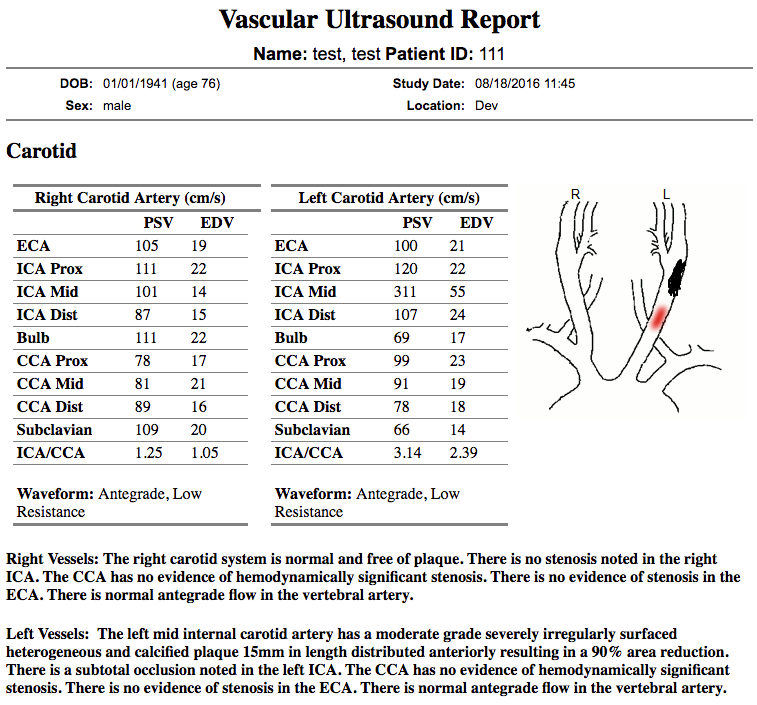
The Vascular Report
This is a carotid example including measurements, a diagram and a text conclusion. Combined vascular studies (Aorto-iliac with distal runoff) are easy to document.


